Just What is an IOTTA?  Inquiring Minds Learn Now!

SNIA’s twelve Technical Work Groups collaborate to develop and promote vendor-neutral architectures, standards, and education for management, movement, and security for technologies related to handling and optimizing data. One of the more unique work groups is the  SNIA Input/Output Traces, Tools, and Analysis Technical Work Group (IOTTA TWG). SNIA Compute, Memory, and Storage Initiative recently sat down with IOTTA TWG Chairs Geoff Kuenning of Harvey Mudd College and Tom West of hyperI/O LLC to learn about some exciting new developments in their work activities and how SNIA members and colleagues can get involved. Q: What does the IOTTA TWG do? A: The IOTTA TWG is for those interested in the use of empirical data/metrics to better understand the actual operation and performance characteristics of storage I/O, especially as they pertain to application workloads. Read More

Power Efficiency Measurement – Our Experts Make It Clear – Part 2

Measuring power efficiency in datacenter storage is a complex endeavor. A number of factors play a role in assessing individual storage devices or system-level logical storage for power efficiency. Luckily, our SNIA experts make the measuring easier! In this SNIA Experts on Data blog series, our experts in the SNIA Solid State Storage Technical Work Group and the SNIA Green Storage Initiative explore factors to consider in power efficiency measurement, including the nature of application workloads, IO streams, and access patterns; the choice of storage products (SSDs, HDDs, cloud storage, and more); the impact of hardware and software components (host bus adapters, drivers, OS layers); and access to read and write caches, CPU and GPU usage, and DRAM utilization. Join us on our journey to better power efficiency as we continue with Part 2: Impact of Workloads on Power Efficiency Measurement.  And if you missed Part 1: Key Issues in Power Efficiency Measurement, you can find it here.  Bookmark this blog  and check back in March and April for the continuation of our four-part series. And explore the topic further in the SNIA Green Storage Knowledge Center. Part 2: Impact of Workloads on Power Efficiency Measurement Read More

Feedback Needed on New Persistent Memory Performance White Paper

A new SNIA Technical Work draft is now available for public review and comment – the SNIA Persistent Memory Performance Test Specification (PTS) White Paper.

A companion to the SNIA NVM Programming Model, the SNIA PM PTS White Paper (PM PTS WP) focuses on describing the relationship between traditional block IO NVMe SSD based storage and the migration to Persistent Memory block and byte addressable storage.

The PM PTS WP reviews the history and need for storage performance benchmarking beginning with Hard Disk Drive corner case stress tests, the increasing gap between CPU/SW/HW Stack performance and storage performance, and the resulting need for faster storage tiers and storage
products.

Read More

Judging Has Begun – Submit Your Entry for the NVDIMM Programming Challenge!

We’re 11 months in to the Persistent Memory Hackathon program, and over 150 software developers have taken the tutorial and tried their hand at programming to persistent memory systems.   AgigA Tech, Intel SMART Modular, and Supermicro, members of the SNIA Persistent Memory and NVDIMM SIG, have now placed persistent memory systems with NVDIMM-Ns into the SNIA Technology Center as the backbone of the first SNIA NVDIMM Programming Challenge.

Interested in participating?  Send an email to PMhackathon@snia.org to get your credentials.  And do so quickly, as the first round of review for the SNIA NVDIMM Programming Challenge is now open.  Any entrants who have progressed to a point where they would like a review are welcome to contact SNIA at PMhackathon@snia.org to request a time slot.  SNIA will be opening review times in December and January as well.  Submissions that meet a significant amount of the judging criteria described below, as determined by the panel, will be eligible for a demonstration slot to show the 400+ attendees at the January 23, 2020 Persistent Memory Summit  in Santa Clara CA.

Your program or results should be able to be visually demonstrated using remote access to a PM-enabled server. Submissions will be judged by a panel of SNIA experts.  Reviews will be scheduled at the convenience of the submitter and judges, and done via conference call.

NVDIMM Programming Challenge Judging Criteria include:

Use of multiple aspects of NVDIMM/PM capabilities, for example:

  1. Use of larger DRAM/NVDIMM memory sizes
  2. Use of the DRAM speed of NVDIMM PMEM for performance
  3. Speed-up of application shut down or restart using PM where appropriate
  4. Recovery from crash/failure
  5. Storage of data across application or system restarts

Demonstrates other innovative aspects for a program or tool, for example:

  1. Uses persistence to enable new features
  2. Appeals across multiple aspects of a system, beyond persistence

Advances the cause of PM in some obvious way:

  1. Encourages the update of systems to broadly support PM
  2. Makes PM an incremental need in IT deployments

Program or results apply to all types of NVDIMM/PM systems, though exact results may vary across memory types.

Questions? Contact Jim Fister, SNIA Hackathon Program Director, at pmhackathon@snia.org, and happy coding!

Learn the Latest on Persistence at the 2020 Persistent Memory Summit

The 2020 SNIA Persistent Memory Summit is coming to the Hyatt Regency Santa Clara on Thursday, January 23, 2020. The day before, on January 22, an expanded version of the SNIA Persistent Memory Hackathon will return, co-located again with the SNIA Annual Members Symposium. We’ll share Hackathon details in an upcoming SNIA Solid State blog. For those who have already attended a Persistent Memory Summit, you will find significant changes in the makeup of the agenda.  For those who have never attended, the new agenda might also be an opportunity to learn more about development options and experiences for persistent memory. The focus of the 2020 Summit will be on tool and application development for systems with persistent memory.  Read More

Your Questions Answered – Now You Can Be a Part of the Real World Workload Revolution!

The SNIA Solid State Storage Initiative would like to thank everyone who attended our webcast: How To Be Part of the Real World Workload Revolution.  If you haven’t seen it yet, you can view the on demand version here.  You can find the slides here. Eden Kim and Jim Fister led a discussion on the testmyworkload (TMW) tool and data repository, discussing how a collection of real-world workload data captures can revolutionize design and configuration of hardware, software and systems for the industry.   A new SNIA white paper available in both English and Chinese authored by Eden Kim, with an introduction by Tom Coughlin of Coughlin Associates and Jim Handy of Objective Analysis, discusses how we can all benefit by sharing traces of our digital workloads through the SNIA SSSI Real-World Workload Capture program. In an environment where workloads are becoming more complex — and the choices of hardware configuration for solid-state storage are growing — the opportunity to better understand the characteristics of data transfers to and from the storage systems is critical.  By sharing real-world workloads on the Test My Workload repository, the industry can benefit overall in design and development at every level from SSD development to system configuration in the datacenter. There were several questions asked in and after the webcast.  Here are some of the answers.  Read More

Your Questions Answered – Now You Can Be a Part of the Real World Workload Revolution!

The SNIA Solid State Storage Initiative would like to thank everyone who attended our webcast: How To Be Part of the Real World Workload Revolution.  If you haven’t seen it yet, you can view the on demand version here.  You can find the slides here.

Eden Kim and Jim Fister led a discussion on the testmyworkload (TMW) tool and data repository, discussing how a collection of real-world workload data captures can revolutionize design and configuration of hardware, software and systems for the industry.   A new SNIA white paper available in both English and Chinese authored by Eden Kim, with an introduction by Tom Coughlin of Coughlin Associates and Jim Handy of Objective Analysis, discusses how we can all benefit by sharing traces of our digital workloads through the SNIA SSSI Real-World Workload Capture program.

In an environment where workloads are becoming more complex — and the choices of hardware configuration for solid-state storage are growing — the opportunity to better understand the characteristics of data transfers to and from the storage systems is critical.  By sharing real-world workloads on the Test My Workload repository, the industry can benefit overall in design and development at every level from SSD development to system configuration in the datacenter.

There were several questions asked in and after the webcast.  Here are some of the answers.  Any additional questions can be addressed to asksssi@snia.org.

Q: Shouldn’t real world workloads have concurrent applications?  Also, wouldn’t any SQL workloads also log or journal sequential writes?

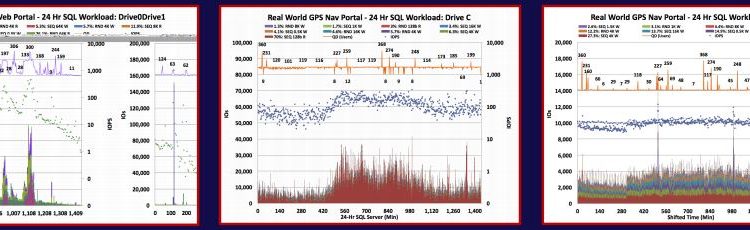
A: Yes.  Each capture shows all of the IO Streams that are being applied to each logical storage recognized by the OS.  These IO Streams are comprised of IOs generated by System activities as well as a variety of drivers, applications and OS activities.  The IOProfiler toolset allows you to not only see all of the IO Stream activity that occurs during a capture, but also allows you to parse, or filter, the capture to see just the IO Streams (and other metrics) that are of interest.

Q: Is there any collaboration with the SNIA IOTTA Technical Work Group on workload or trace uploading?

A:  While IOTTA TWG and SSS TWG work closely together, an IO Capture is fundamentally different from an IO Trace and hence is not able to be presented on the IOTTA trace repository.  An IO Trace collects all of the data streams that occur during the IO Trace capture period and results in a very large file.  An IO Capture, on the other hand, captures statistics on the observed IO Streams and saves these statistics to a table.  Hence, no actual personal or user data is captured in an IO Capture, only the statistics on the IO Streams. Because IO Captures are a series of record tables for individual time steps, the format is not compatible with a repository for the streaming data captured in an IO Trace.

For example, an IO Trace could do a capture where 50,000 RND 4K Write and 50,000 RND 4K Read IOPS are recorded, resulting in 100,000 4K transfers, or 40M bytes of data.  OTOH, an IO Capture that collects statistics would log the fact that 50,000 RND 4K Writes and 50,000 RND 4K Reads occurred… a simple two item entry in a table.  Of course, the IOPS, Response Times, Queue Depths and LBA Ranges could also be tracked resulting in a table of 100,000 entries times the above 4 metrics, but 400,000 table entries is much smaller than 40 MB of data.

Both of these activities are useful, and the SNIA supports both.

Q: Can the traces capture a cluster workload or just single server?

A: IO Captures capture the IO Streams that are observed going from User space to all logical storage recognized by the OS.  Accordingly, for clusters, there will be an individual capture for each logical unit.  Note that all logical device captures can be aggregated into a single capture for analysis with the advanced analytics offered by the commercial IOProfiler tools.

Q: Have you seen situation where the IO size on the wire does not matched what application request?  Example Application request 256K but driver chopped the IO into multiple 16K before sent to the storage. How would we verify this type of issue?

A: Yes, this is a common situation. Applications may generate a large block SEQ IO Stream for video on demand.  However, that large block SEQ IO Stream is often fragmented into concurrent RND block sizes.  For example, in Linux OS, a 1MB file is often fragmented into random concurrent 128K block sizes for transmission to and from storage, but then coalesced back into a single 1024K BS in user space..

Q: Will you be sharing the costs for your tools or systems?

A: The tool demonstrated in the webcast is available free at testmyworkload.com (TMW).  This is done to build the repository of workloads at the TMW site.  Calypso Systems does have a set of Pro tools built around the TMW application.  Contact Calypso for specific details.

Q: Can the capture be replayed on different drives?

A: Yes.  In fact, this is one of the reasons that the tool was created.  The tool and repository of workloads are intended to be used as a way to compare drive and system performance, as well as tune software for real-world conditions.

Q: How are you tracking compressibility & duplication if the user does not turn on compression or dedupe?

A: The user must turn on compression or duplication at the beginning of the capture to see these metrics.

Q: An end user can readily use this to see what their real world workload looks like.  But, how could an SSD vendor mimic the real world workload or get a more “realworld-like” workload for use in common benchmarking tools like FIO & Sysbench?

A: The benchmarking tools mentioned are synthetic workloads, and write a predictable stream to and from the drive.  IO Captures ideally are run as a replay test that recreates the sequence of changing IO Stream combinations and Queue Depths observed during the capture.  While the Calypso toolset can do this automatically, free benchmark tools like FIO and sysbench may not be able to change QDs and IO Stream combinations from step to step in a test script.  However, the IO Capture will also provide a cumulative workload that list the dominant IO Streams and their percentage of occurrence.  This list of dominant IO Streams can be used with fio or sysbench to create a synthetic composite IO stream workload.

Q: Is it possible to use the tool to track CPU State such as IOWAIT or AWAIT based on the various streams?

A: Yes, IO Captures contain statistics on CPU usage such as CPU System Usage %, CPU IO Wait, CPU User usage, etc.

Q: Can we get more explanation of demand intensity and comparison to queue depth?

A: Demand Intensity (DI) is used to refer to the outstanding IOs at a given level of the software/hardware stack.  It may be referred to simply as the outstanding Queue Depth (QD) or as the number of outstanding Thread Count (TC) and QD.  The relevance of TC depends on where in the stack you are measuring the DI.  User QD varies from level to level and depends on what each layer of abstraction is doing.  Usually, focus is paid to the IO Scheduler and the total outstanding IOs at the block IO level.  Regardless of nomenclature, it is important to understand the DI as your workload traverses the IO Stack and to be able to minimize bottlenecks due to high DI.

Q: In these RWSW application traces do these include non-media command percentages such as identify and read log page (SMART), sleep states, etc.?  Depending on the storage interface and firmware this can adversely affect performance/QoS.

A: IO Capture metrics are the IO Streams at the logical storage level and thus do not include protocol level commands.  Non performance IO commands such as TRIMs can be recorded, and SMART logs can be tracked if access to the physical storage is provided.

Q: Isn’t latency a key performance metric for these workloads so collecting only 2 minute burst might not show latency anomalies?

A: IO Captures average the statistics over a selected time window.  Each individual IO Stream and its metrics are recorded and tabulated on a table but the time window average is what is displayed on the IO Stream map.  Of course, the min and max Response times over the 2 minute window are displayed, but the individual IO latencies are not displayed.  In order to track IO Bursts, the time window resolution should be set to a narrow time range, such as 100 mS or less, in order to distinguish IO Bursts and Host Idle times.

Calling All Real-World Workloads

Video streaming is an easy-to-understand workload from the I/O perspective, right?  It’s pretty obvious that it’s a workload heavy on long, streaming reads. The application can be modeled with a consistent read flow, and the software tests should be easy.  However, an analysis of the real-world workload shows something very different. At the disk level, the reads turn out to be a rapid flow of 4k and 8k block reads from a solid-state-disk.  Further, other processes on the system also add in a small amount of 4k and 8k writes in the midst of the reads. All of this impacts the application –and an SSD — which was likely heavily tested on the basis of long, streaming reads. Understanding the real-world characteristics of a workload can be a significant advantage in the development of new hardware, new systems, and new applications.   The SNIA Solid State Storage Initiative (SSSI) and SSSI member company Calypso Systems are providing an opportunity to build a repository of workloads for the industry to use for real-world testing, as outlined in a new SSSI white paper How to Be a Part of the Real-World Workload Revolution. Read More

Calling All Real-World Workloads

Video streaming is an easy-to-understand workload from the I/O perspective, right?  It’s pretty obvious that it’s a workload heavy on long, streaming reads. The application can be modeled with a consistent read flow, and the software tests should be easy.  However, an analysis of the real-world workload shows something very different. At the disk level, the reads turn out to be a rapid flow of 4k and 8k block reads from a solid-state-disk.  Further, other processes on the system also add in a small amount of 4k and 8k writes in the midst of the reads. All of this impacts the application –and an SSD — which was likely heavily tested on the basis of long, streaming reads.

Understanding the real-world characteristics of a workload can be a significant advantage in the development of new hardware, new systems, and new applications.   The SNIA Solid State Storage Initiative (SSSI) and SSSI member company Calypso Systems are providing an opportunity to build a repository of workloads for the industry to use for real-world testing, as outlined in a new SSSI white paper How to Be a Part of the Real-World Workload Revolution. This paper is also available in Chinese at the SSSI Knowledge Center White Papers page.

By going to the TestMyWorkload site, anyone can participate by providing a trace capture of an I/O workload that can be used by others to develop better products. The capture itself traces the block transfers, but does not capture actual data.  Any workload replay would use representative blocks, so there are no concerns about data security or integrity from these captures.

The repository can be used by any participant to test hardware and software, and can help system vendors and users optimize configurations for the best performance based on real-world data.  By participating in this effort, organizations and individuals can provide insight and gain from the knowledge of all the contributors.

Follow these three steps to be a part of the revolution today!

1.  Read the white paper.

2.  Download the free capture tools at TestMyWorkload.com.

3. Mark your calendar and register HERE to learn more in the free SNIA webcast How to Be a Part of the Real-World Workload Revolution on July 9 at 11:00 am Pacific/2:00 pm Eastern.

Your Questions Answered on Non-Volatile DIMMs

  by Arthur Sainio, SNIA NVDIMM SIG Co-Chair, SMART Modular SNIA’s Non-Volatile DIMM (NVDIMM) Special Interest Group (SIG) had a tremendous response to their most recent webcast:  NVDIMM:  Applications are Here!  You can view the webcast on demand. Viewers had many questions during the webcast.  In this blog, the NVDIMM SIG answers those questions and shares the SIG’s knowledge of NVDIMM technology. Have a question?  Send it to nvdimmsigchair@snia.org. 1. What about 3DXpoint, how will this technology impact the market? Read More